HR Analytics
July 11, 2023
A Comprehensive Guide on Data Integration, Cleaning, and Visualization
The role of data in driving decision-making has become increasingly prevalent in all aspects of business. People analytics, which applies statistical analysis to employee-related data to guide decisions, is a prime example of this shift. But despite the clear benefits, many companies are finding the path to effective people analytics challenging. Recent studies reveal the three most difficult elements to be data integration, cleaning, and visualization.
The Three Hurdles in People Analytics
Almost half (49%) of businesses find data integration fairly or very difficult. Integrating data involves consolidating information from various sources into a single, unified view, a critical process in analytics. It's the first step to transforming raw data into insightful information.
Following closely, data cleaning is a sticking point for just over two-fifths (42%) of organizations. The process of cleaning data entails eliminating errors, inconsistencies, and duplicates to ensure the quality and reliability of data.
Finally, just under two-fifths (38%) of companies find data visualization fairly or very difficult. Visualization is an essential part of communicating data-driven insights. It translates complex datasets into intuitive graphical representations, enabling stakeholders to grasp the narrative at a glance.
Simplifying Data Integration
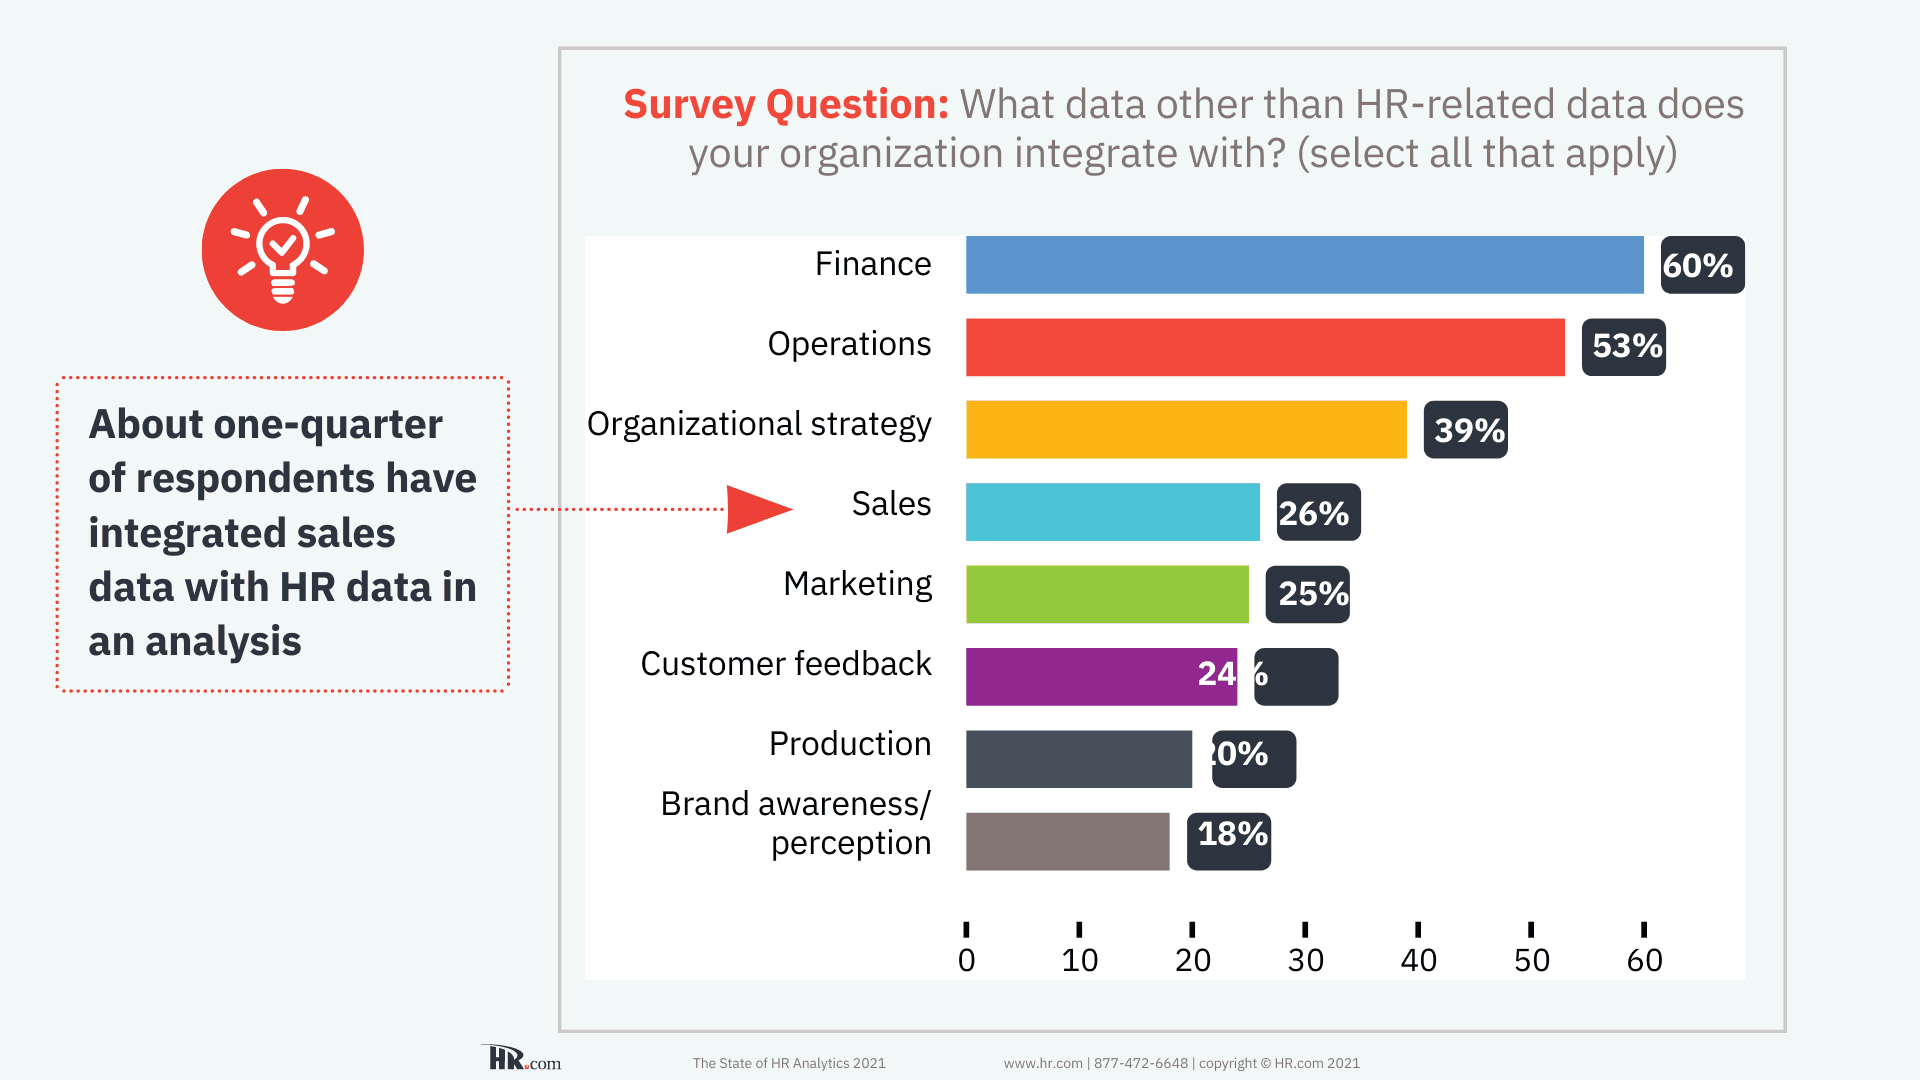
Data integration involves collecting and merging data from various sources to offer a holistic view of your workforce. According to recent findings, HR professionals are most likely to integrate HR data with data from other departments such as finance (60%), operations (54%), organizational strategy (39%), sales (26%), marketing (25%), customer feedback (24%), production (20%), and brand perception (18%). This integrated approach can reveal significant insights and foster better decision-making. Here's how to streamline this process:
i. Understand Your Data Sources
Before the actual integration process, understanding where your data comes from is crucial. In the HR context, data is often collected from diverse sources such as:
HR Management Systems (HRMS): These platforms store a wealth of data on employee demographics, hiring, turnover, and more.
Performance Management Systems: These platforms contain data related to employee performance reviews, objectives, and key results (OKRs).
Finance Systems: Crucial for compensation and benefits data, along with data on the financial performance of the business.
Operations Systems: These systems hold data on daily operations, which can help link HR initiatives to operational outcomes.
Customer Feedback Systems: Customer feedback can help HR understand how workforce changes impact customer satisfaction.

ii. Invest in Robust Integration Tools
A multitude of integration tools available in the market can help streamline the process of merging data from various sources. These tools generally offer features like APIs and pre-built connectors.
APIs allow different software systems to interact and exchange data. This means you can automate the process of pulling data from your HR system, CRM, or other sources into your analytics platform.
Pre-built connectors work in a similar way, but they are designed to integrate with popular platforms without the need for custom coding, thus simplifying the integration process and reducing potential errors.
When selecting an integration tool, ensure it can handle the volume and complexity of your data and supports the systems you currently use. Additionally, it should be scalable to accommodate future growth and changes in your data needs.
iii. Establish Data Standards
Having a uniform data structure can drastically simplify the process of data integration. This involves implementing company-wide data standards and formats.
Data standards are rules or guidelines that dictate how data should be recorded and formatted. For instance, a simple standard might be deciding whether dates are recorded in the format MM/DD/YYYY or DD/MM/YYYY. Consistency in such simple things can save hours of data cleaning later.
Standards should be established for all types of data you collect. This includes employee data, performance data, and even metadata (data about your data). Having these standards in place ensures that all data entering your system is consistent, which in turn makes the process of integration less complex and more efficient.
iv. Develop a Data Governance Framework
A data governance framework is a set of procedures and guidelines that govern the overall management of a company's data. This encompasses everything from data quality and privacy to data integration and usage.
Roles and Responsibilities: The framework should clearly define who is responsible for different aspects of data management, including data integration. This may include data owners, data stewards, and data users, each with their own set of responsibilities. Having clearly defined roles ensures accountability and streamlines the decision-making process.
Data Policies and Procedures: The governance framework should also outline the specific policies and procedures to be followed when integrating new data. This might include steps for validating data quality, protocols for handling sensitive data, and procedures for resolving data conflicts.
Compliance and Security: Another important aspect of data governance is ensuring compliance with relevant data regulations and maintaining data security. This includes processes for regular data audits, privacy impact assessments, and incident response procedures.

2. Enhancing Data Cleanin
Data cleaning is the process of reviewing and revising data to improve its accuracy and quality. Without clean data, any subsequent analytics may be skewed, leading to potentially incorrect insights and decision-making. Here's how you can enhance your data cleaning process:
i. Automate the Cleaning Process
Several data cleaning tools are available that use algorithms to identify and correct errors, such as duplicates, misspellings, or inconsistencies. These tools can also help identify missing data and either fill in the gaps or flag them for review. Automation can save significant time compared to manual data scrubbing, enhancing efficiency, and improving your data's overall accuracy.
ii. Create a Data Quality Team
This team is responsible for maintaining the quality of your data, ensuring your analytics are based on accurate and reliable information. The team should regularly review the data, identify and correct any issues, and work to prevent future errors. Having dedicated personnel for this task can help ensure data quality is always maintained at a high standard.
iii. Implement Real-time Cleaning
Real-time data cleaning is the process of cleaning data as it enters your system. This could involve checking for duplicates, ensuring required fields are filled in, and validating data (e.g., checking that dates are in the correct format). Implementing real-time cleaning as part of your data integration process means you're only ever working with clean, consistent data, reducing the need for large-scale data clean-ups later on.
3. Optimizing Analytics Visualization

Data visualization involves presenting your analytical results in a visual format, such as graphs, charts, or even heat maps. Effective visualization is crucial as it makes your analytics more understandable and accessible to a wide range of stakeholders. Here are some strategies to enhance your visualization:
i. Utilize User-friendly Visualization Tools
Several tools are available that offer intuitive, drag-and-drop interfaces for creating visualizations. These tools often come with a range of options for how to present your data, allowing you to choose the one that best communicates your message. By making it easier for non-technical team members to create and understand visualizations, you can help foster a data-driven culture within your organization.
ii. Conduct Training and Skill Development Sessions
Not everyone is naturally skilled at understanding or creating data visualizations. Regular training sessions can help develop these skills within your team. Training can focus on both the technical aspects of using your chosen visualization tool, as well as the design principles behind effective data presentation.
iii. Experiment with Different Visualization Types
Different types of visualizations can communicate different messages. Don't limit yourself to the basics. Experiment with various visualization types. The more tools you have at your disposal, the better you can tailor your visualization to your data's story.
Streamline Your People Analytics Journey with eqtble
While the challenges in people analytics might seem daunting, the right strategies, tools, and processes can turn these obstacles into opportunities. And, that's where eqtble can make all the difference.
eqtble helps people teams streamline data integration from a wide variety of sources including recruitment, performance management, compensation, engagement surveys, and more, ensuring you have all the insights at your fingertips.
Our platform also leverages automation to clean data in real-time, reducing manual intervention and maintaining high data quality. Our commitment is to offer you accurate and reliable data that can be trusted for decision-making.
But eqtble doesn't stop at providing clean, integrated data. We offer intuitive and easy-to-use data visualization features. These enable you to depict your data story in a way that is both engaging and easy to understand.
At eqtble, we believe that training and development are crucial to maximising the use of people analytics. Therefore, we provide support and resources to help your team learn and grow in their ability to leverage our tool for your unique needs.
By choosing eqtble, you're not just adopting a platform; you're partnering with a team dedicated to making people analytics work for you. We're committed to turning your data into actionable insights that drive business success. Schedule a demo today!


